
Hello Everyone! I admit silence for a little while now. My goal is to start writing more frequently and more regularly. At this point in my life I am in a transition so its very difficult for me to write. Once I get settled, I’m going to dig into a niche and do it very well. I hope this happens very soon as I enjoy writing about a topic I enjoy and helping everyone learn!
Month: January 2018
Captain’s Log 005 – Keeping the Books
Trying to make money through investment is pointless if you’re not keeping the books! How would you know if you were making money, or losing it? I struggled with this. Before I even began purchasing crypto to add to a collection I did what every good engineer does. I made a spreadsheet! In this blog post, I will walk you through creating a spreadsheet to keep track of your cryptocurrency. The spreadsheet will do three things; serve as an input for your holdings, maintain live pricing for each of your holdings, and keep a of log your transactions so you’ll know what your gains or losses are. There are apps out here that will do this for you, but for me having tight control over maging my crypto was important. Also, I a do it yourself DIY oriented. Using an app was analogous to checking my work more than anything else.
Enter the power of a spreadsheet! For this blog post, I’ll use Google Sheets. One might use Microsoft Excel. For the most part, the formulas used are the same. I came up with a three sheet flow. From left to right I have a sheet to track all my wallet amounts, an index tracker, and a transaction log. There is also a fourth sheet which I use to source information for coin prices and market capitalization data. I realize not everyone is spreadsheet proficient, so I will do my best to explain formulas as I go. If you find yourself misunderstanding me, please drop me a line and I’m happy to go over something with you.
To start out, I’ll go over how one might consider tracking their wallets information. I am not talking about private keys, rather just the amount of coins or tokens each wallet has. This is where inputs go. Two things to think about how I track wallets. A single wallet contains all your coins, true. However, you might want to look at them in different buckets in a financial sense. For me, the two buckets were an index portfolio and the other was for long term hold.

You can see here the example has two Bitcoin addresses; two wallets. I left a placeholder for the receive addresses and a link column for linking to an address scan tool, such as blockchain.info [1]. Honestly, those two columns are there for extra info and I like having it there for my reference. Next two columns hold quantity data or how I want to split the funds in the same wallet for tracking purposes. The index quantity is the portion of the wallet funds I want to put in my index portfolio, and the hold quantity is excluded from the index and treated separately. I did this originally because I knew that some of the coins I was investing in would be held for a very long time, and I didn’t want those to skew my index weighting. Lastly, a subtotal row adds up the quantity columns and a final total beneath that. I have noted what each wallet is for reference. Obviously, you’d repeat this for multiple coins.
Before I jump into tracking an index, pricing information is needed. Before I learned the formula I’m about to share with you, I was entering the data in manually. There had to be a better way. One of the earliest sources of pricing information I came across was the coinmarketcap website; https://coinmarketcap.com/ [2]. You get lot of good information there, but it is not the only source out there so I encourage you to hunt for others should you wish to do so. I discovered the “IMPORTHTML” formula, and on a seperate sheet I entered:
=IMPORTHTML(“https://coinmarketcap.com/”,”table”,1)
Google sheets takes the website URL and the arguments provided to extract the table information for table 1. On coinmarketcap, the first table contains information for coins 1 – 100 kept in order of which coins has the largest market capitalization by default. If the argument ‘1’ was changed to ‘2’, then the table would be imported would be coins 101-200. What I did was repeat the formula for the first 300 coins. I spread the formula by 100 rows to avoid overwriting tables; Eg table 1 formula goes in cell A1, table 2 goes in cell A101, etc…
Here is a screenshot of coinmarketcap.com and beneath it is the imported representation in the spreadsheet.


With the information organized neatly into rows and columns, you can now search create an index spreadsheet that uses the data.
If you recall from my previous post on indexing your funds, you’ll know there are many different ways to do it. Let’s assume for the moment you have 10 coins you want to create an index portfolio about. In one fashion, you could buy an equal amount of each coin. That is if you spent $100 on each coin for a total of $1000 overall, then you have weighted each coin by 10%. This is an equal index strategy. For simplicity’s sake, it is easy to use but you don’t get full market exposure doing so. Another way to do it is by weighing each investment by market capitalization. The bigger share of the overall market an asset has, the larger share of the overall portfolio yours takes. A benefit to using this strategy is a more complete exposure to the market and therefore better chance your portfolio will go up and down with the market overall. A disadvantage is the blend of the funds you put into the index. Let’s say you only chose coins with a large market capitalization, such as Bitcoin, Ethereum, and Ripple. You have large capitalization coins in the index, but you’re missing out on the other middle and smaller capitalization funds. One might take the market capitalization index strategy a step further by choosing coins that are a blend of large, medium and small capitalization. Check out investopedia for more information on indexing, if your curious [3]. To be clear the spreadsheet method I use contains this market capitalization strategy.
As a rule, just because a coin has a large market capitalization, that does not generally mean the coin price is stable. Volatility is prevalent in all areas of cryptocurrency trading, so do your research and pick coins which you believe in. Don’t just chose the big players. Give the little ones some attention too! Imagine if you had done this with Amazon before a share of that stock was worth $1000 like it is today; roughly. A good example is Siacoin [4]. They were a small fish a year ago when they first started, but they’ve earned a larger share of the market as their technology has evolved. I’m not saying buy siacoin, but rather using it as an example of a small cap coin that grew from $0.002 to $0.03 over time.

In this example there are five crypto assets with example data in the amount column. I wish I had that much! Now, tracking your portfolio on a spreadsheet can be done by sourcing the index data from your wallet sheet. That way you don’t have to input your wallet amount twice! To do this enter:
=!A1
Where inside the is the name of the sheet you stored your wallet information and A1 is the cell of the subtotal that is for your index fund. There is a seperate section dedicated for coins to be held, but the data is sourced in the same manner.
Here’s where more formula magic occurs. One could simply use the same method as getting the coin amounts from the wallet page with the live price and market capitalization, but as time progresses the data changes. That means, if on your coin info sheet you reference a row for a coin then you’re actually referencing that row in the sheet not the website. If that particular coin changes and moves up from say position 10 to 8 overnight on the website, now your sheet is wrong because the 10th row in your spreadsheet is now some other coin when it updates. Why is this a problem? Because if you’re like me you want to automate this process so you don’t have to spend 10 minutes scratching your head about why your spreadsheet is wrong!
Here’s the solution. First, since the position of the fund might change rows in the spreadsheet, that means you’ll have to go find it every time just to be sure. But, how do you make a spreadsheet do that? Nifty formulas you spend hours researching of course! If you use the coin name as an input, you can write a formula that will find the index in the spreadsheet and extract the value of interest.
If you look at the screenshot where “BTC Bitcoin” is entered you can see that on the coinmarketcap spreadsheet that was imported. The spelling must be exact!
=index(CoinMarketCap!$D$2:$D$205,match(B2,CoinMarketCap!$B$2:$B$204,0),1)
The formula reads as such: Match the coin name in cell B2, which was “BTC Bitcoin”, to the entire column with names in it from the coinmarketcap spreadsheet. The match function returns the row number of that coin in the spreadsheet. Then that result is fed into the index function which simply reads, “at the index row where ‘BTC Bitcoin’ was found, go over to the D column where the pricing information is and pull the data”. For the uninitiated, the ‘$’ signs in spreadsheet speak means to always reference that cell when you copy the formula. Otherwise if you copy the formula one cell to the right D2 would become D3 if you didn’t use the dollar sign. Repeat this for the market capitalization information. That means the column D will change to a different one where the market capitalization values are.
Now with the new pricing information, one can multiply the number of coins by the price to obtain the current market value. To see portfolio allocation, divide the market value of an asset by the total portfolio value. Using market capitalization data, do the same thing in another column. Divide the market capitalization of one asset by the total of all assets. You will have two numbers. An actually portfolio weight for an asset and a market weight. You’re attempting to match them. The extra two columns, “drift” and “OK?” can be programmed to tell you how much your are off by. Simply put it’s a difference of actual versus desired. What you’re off you get to the hard part! Rebalancing.
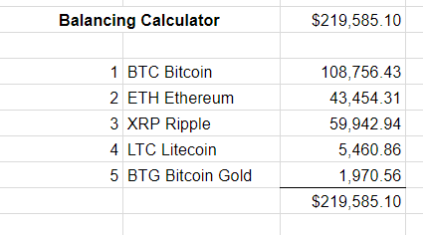
I’ve made a rebalancing calculator which takes all the index funds and calculates how they are to be spread in terms of value to reach the market capitalization weights. To achieve this information, take the total market value of all assets and multiply them by the percentage of market capitalization from the desired weight calculation in the target allocation column.
The hard part now comes in the form of selling your shares appropriately and buying back in with other assets to achieve the value calculated. Given how volatile each asset is, one might choose not to do this but once a year or however long is appropriate for you. To give an idea of bitcoin volatility, check this website out here [5]. The calculator can be used similarly to see how much of each asset to buy everytime you invest a dollar amount. My methods tend to be a bit haphazard at the moment where I buy a coin in an amount and add it to the portfolio. I fully intend to rebalance in the future once I ride out the market for a bit. At that time, perhaps, I’ll cover the procedure.
The index sheet shows you how your overall portfolio is weighted but it does not tell you how well you’ve done. Therefore last but not least comes the transaction log where you must enter in buys and sells.

In this example a series of bitcoin purchases are made and a sell. The amount price and amount column tracks the data on the day the transaction occurred. Buys are positive and sells are negative. In the market value and total columns the same thing happens but these columns track the current market price of buys and sells as if you sold it the day you looked at the sheet.
To get a cost basis, add up all amounts in the amount column. Similarly, the same for the market value column. Earnings or Loss is calculated by the following formula:
=if(K3-K2 > 0,(K3-K2),(K2-K3))
Using this formula ensures that a number with the correct sign shows. If the current value minus what you bought it for (cost basis) is positive, show that value, otherwise reverse the subtraction. The percentage is calculated by dividing the current value by the cost basis and subtracting one:
=((K3/K2)-1)
I have taken my spreadsheet and made a template out of it and left it for you to use here:
https://docs.google.com/spreadsheets/d/1oy2KoYAfuKdtzld35bG1yr91a3GrzR-ZlcSHDjrj89c/edit?usp=sharing
Anyone can download it and reuse it to their liking. I am always working to improve the spreadsheet, so if you have updates or suggestions please email them to me at:
cointrekkie [at] gmail.com
Or, comment below and let me know how to get in touch. Twitter and Facebook also work if you prefer to use either of those.
I use a tool at his website to check my work and I invite you to play around with it too:
https://coins.live/ [6].
Right now my index portfolio is making good gains in the market and that’s where the bulk of my progress is right now “on paper”. At the time I didn’t have the money to run out and buy mining equipment, but that is coming soon! In my next blog post I am going to cover purchasing Ripple XRP because my followers have asked me to do so. I hope this information has given you a tool to track your investment progres, or at least armed you with the knowledge to create your own method of doing so. My purpose it to become knowledgeable about using cryptocurrencies in all manner, earning it and teaching others about it. I realize most of my posts so far have lended toward investments but intend to start diving into earning and usage in future posts.
Reference
